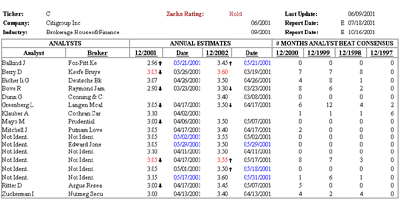
The Annual EPS Accuracy Report shows how many months in a particular year, an analyst's estimate was more accurate than that month's consensus for that fiscal year.
Period of Evaluation
For Estimate Performance calculations Zacks is using the monthly forecasts of fiscal year earnings for the last four years.
Eligibility
To be eligible, an analyst must have (a) rated at least three separate stocks within a given industry for the past five years, and (b) have at least one EPS forecast on file for the current fiscal year. This second requirement is meant to ensure that, although an analyst may not have issued buy or sell ratings for any of his or her stocks during the most recent year, the analyst is still following the industry.
|
The Zacks Rating is based on our proprietary model that uses earnings estimate revisions and earnings surprises to predict short-term price movements. Stocks are rated as a Strong Buy, Buy/Outperform, Hold, Sell/Underperform, or a Strong Sell. These ratings have shown to be an accurate predictor of stock price performance (relative to the market) for the coming 90-180 days as oppose to the analyst's long-term predictions that usually represent a 6-12 month outlook. The Zacks Rank is also a relative measure, comparing stock against the entire universe of stocks, and the distribution of ranks reflects this: approximately 20% of stocks are ranked Buy/Outperform or Strong Buy; 60% of stocks are ranked Hold; and 20% ranked Sell/Underperform or Strong Sell.
Analyst: Under the Analyst heading is a list of the names of the individual analysts. If the analyst name is listed as Not Ident - it means that you do not have an authorization to view the name. You can click the Analyst heading to sort the column. Broker: Under the Broker heading is a list of the names of the brokerage houses and independent research institutions that currently employ the analyst. If the broker name is listed as Not Ident - it means that you do not have an authorization to view the name. You can click the Broker heading to sort the column. When the Broker column has the CO FORECAST entry, it identifies the company's own estimates for the earnings.
The Annual Estimates section lists the analyst's EPS projections for the current and next fiscal years. Current Fiscal Year Estimates
Date of Annual EPS Estimate
Next Fiscal Year Estimates
Date of Annual EPS Estimate
Number of Month Analyst Beats Consensus There are four columns in the # of Month Analyst Beats Consensus display. Each column represents one of the past four company's fiscal years, identified by that fiscal year end date. For each year, we look at the analyst estimate 12 times during that year (at each month end). We then compare that estimate with the consensus on that date and note if the analyst was more accurate than the consensus. As the result, the number of months (out of 12 observations) when the analyst's absolute forecasting error was less than the consensus absolute error is then shown in each column. |
