|
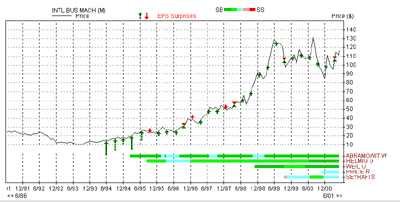
Using the Analyst Rating History charts, you can view how
analyst recommendations have changed over time. To access
the Analyst Rating history, follow these steps:
- At
the Rating Performance report menu, select up to five analysts
whose historical performance you want to evaluate by checking
the box left to the analyst's name.
- Click
the Plot History link.
- The
Analyst Rating History chart will be displayed on the last
used Price Action chart.
How
to interpret the Analyst Rating History chart

The
Analyst Rating History chart displays Analyst Ratings as horizontal
bars on the last used Price Action chart in place of volumes.
Each horizontal bar represents one analyst. The color of the
bar represents the recommendation.
Here
is how these ratings are represented:
|
Color
|
Rating
Description
|
Numeric
Code
|
Letter Code
|
| Dark
Green |
Strong
Buy |
1
|
SB
|
| Green |
Buy/Outperform |
2
|
B
|
| Light
Blue |
Hold
|
3
|
H
|
| Light
Red
|
Sell/Underperform
|
4
|
S
|
| Red |
Strong
Sell |
5
|
SS
|
|
